
Adding charts to your presentations go a long way in assisting your audience comprehend your presentation properly and give your presentation a more polished, and professional look. In fact, charts capture your audience attention, highlight key insights quickly, improve memory retention, and strengthen your message with visual evidence. This is why we created the “how to create charts in Slidemaker”. Hence it assists you create a polished slide.
Slidemaker app charts guide
Below is how to create or how to add charts in Slidemaker app.
- Go to the charts section.
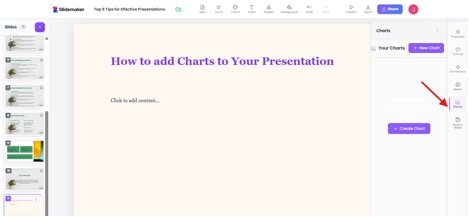
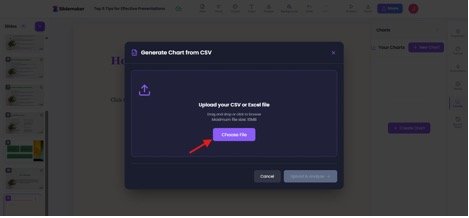
- Click on the ‘create chart’. Then click choose file.
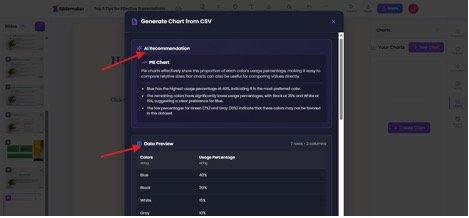
- Slidemaker analyzes the csv file you upload and give suggestions of the kind of chart you could use and also a data preview before it allows you to generate the chart.
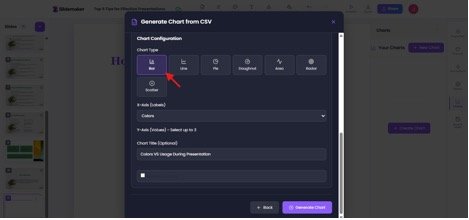
- You can also change the chart type from the Slidemaker option to the one you prefer. You can also add titles. Then you can click the ‘add insight box’ if you want slidemaker to generate insight based on the charts which will be shown on the chart page. You can also add axes, whether the ‘X axis’ and ‘Y axis’. This can be edited to choose which property or values to be placed on either the X axis or Y axis.
While Slidemaker suggests pie charts, let’s choose bar charts and see what is generated.
Then click ‘generate chart’.
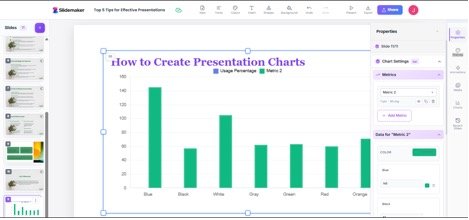
- Then below is the generated chart. You might be surprised that the charts appear like this. You are a few steps away. All you need to do is to click inside the chart. This will pop up the chart metrics beside. Already you must have seen the x axis reading the colors and then the Usage percentage up, which serves for the Y axis.

- Once you click inside the chart, you see the metrics where you can choose the second metrics against the already present x axis (Color axis). You can also choose the bar chart color fill.
And here you go.
Useful Tips to Create Presentation Charts in Slidemaker
- Pick a chart that fits the kind of data you have
- Choose the chart that best shows the point you want to make
- Use charts your audience will easily understand
- Keep it simple and avoid charts with too much data
- Make sure labels and visuals are easy to read
- Use chart styles that match the look of your presentation
Try out the chart features today and share your experience in the comment section. In case you want to see an elaborate guide on how to use Slidemaker.app, click here.